1

I'm trying to plot a graph and color the lines between points based on their slope. The points on my graph only consist of positive values between $0$ and $9$ for both the $X$ and $Y$ axis.

The only thing I can think of is to multiply the result of the slope calculation by some constant value. Unfortunately, this only seems to be giving me a few distinct colors.

Does anyone know of a better way to go about this?

BruceET
  • 51,500
Kahless
  • 228

3 Answers3

2

Something similar is done for complex functions by using the domain coloring technique. First I will explain the idea, and then the application for your case:

A graph of a complex function $g : \Bbb C \to \Bbb C $ of one complex variable lives in a space with two complex dimensions. Since the complex plane itself is two-dimensional, a graph of a complex function is an object in four real dimensions. That makes complex functions difficult to visualize in a three-dimensional space.

The domain coloring technique transforms the points belonging to $f(z)$ into hue, brightness and saturation values, all normalized into $[0,1]$. Usually the argument of the complex number $f(z)$ is converted into a normalized value $[0,1]$ and then associated to a hue value. Then the color associated to $f(z)$ is shown at the position $z$.

In your case you do not have a complex number, but you can use an application of this technique by replacing the argument (angle) of the complex number by the angle of the slope between the two points you are linking (as Arthur said in the comments). This will provide you an $RGB$ triplet based on the value of the angle of the slope that you can use with your favorite programming language to draw the line between the points according to a specific color. Credits of the original ideas in the comments inside the Python code. Please feel free to use it and modify it:

def getting_RGB_from_angle():
    from math import pi

    def hslToRgb(h, s, l):
        # Source of this function: https://stackoverflow.com/questions/2353211/hsl-to-rgb-color-conversion
        # Converts an HSL color value to RGB. Conversion formula
        # adapted from http://en.wikipedia.org/wiki/HSL_color_space.
        # Assumes h, s, and l are contained in the set [0, 1] and
        # returns r, g, and b in the set [0, 1].
        def hue2rgb(p, q, t):
            if t < 0:
                t += 1
            if t > 1:
                t -= 1
            if t < 1/6:
                return p + (q - p) * 6 * t
            if t < 1/2:
                return q
            if t < 2/3:
                return p + (q - p) * (2/3 - t) * 6
            return p

        r,g,b = 0,0,0

        if s == 0:
            r,g,b = l,l,l
        else:
            q=0
            if l < 0.5:
                q=l * (1 + s)
            else:
                q=l + s - l * s

            p = 2 * l - q;
            r = hue2rgb(p, q, h + 1/3)
            g = hue2rgb(p, q, h)
            b = hue2rgb(p, q, h - 1/3)

        return r,g,b

    # example   
    current_angle = pi/3
    r,g,b = hslToRgb(current_angle, 0.5, 0.7) #hslToRgb(hue,saturation,luminance)
    print("Current angle: "+str(current_angle)+"\t Normalized (r,g,b)=("+str(r)+","+str(g)+","+str(b)+")")

# main
getting_RGB_from_angle()

Above is the easiest setting. The angle of the slope will be the normalized value (normalized means that the value is in the range $[0,1]$, several programming languages are able to use those values to print directly the correct $RGB$ color, for instance Python) of the hue of the $RGB$ color, and the saturation and luminance values will be fixed (initially we do not need to make them dynamic, but you could make them variable if you wish to add some rules regarding those values too).
iadvd
  • 8,875
2

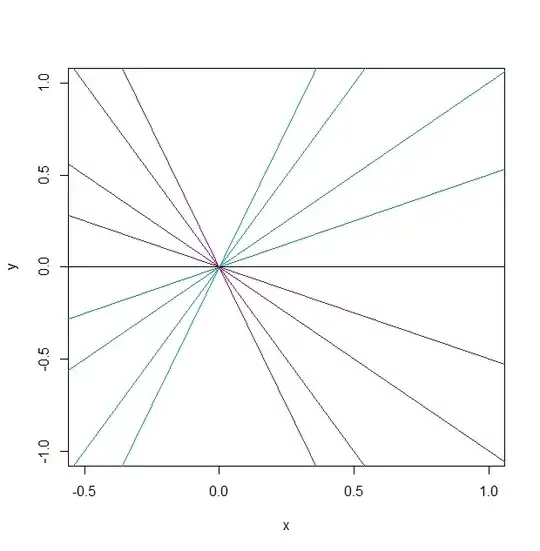
Have the colors mean something. Maybe cool colors (greenish) for positive slope and warm colors (reddish) for negative slope. RGB on scales 0 to 1. Maybe negative slopes have fixed R=.8 and G=0; positive slopes R=0, G=.8. Blue component increases as absolute slope increases. The eye doesn't see colors in direct proportion to RGB, so any scheme requires tuning. But here are results of a crude implementation along those lines (using R):

enter image description here

And the R code, in case it helps you understand the idea. In R, abline plots a line with indicated arguments intercept and slope; color rgb works on a 0 to 1 pixel intensity of R, G, B.

plot(c(-.5,1),c(-1,1), col="white", ylab="y", xlab="x") #set up axes
abline(0, 3, col=rgb(0,.6,atan(abs(3))/2))
abline(0, 2, col=rgb(0,.6,atan(abs(2))/2))
abline(0, 1, col=rgb(0,.6,atan(abs(1))/2))
abline(0,.5, col=rgb(0,.6,atan(abs(.5))/2))
abline(0, 0, col=rgb(0, 0,atan(abs(0))/2))
abline(0,-.5, col=rgb(.6,0,atan(abs(-1))/2))
abline(0,-1, col=rgb(.6,0,atan(abs(-1))/2))
abline(0,-2, col=rgb(.6,0,atan(abs(-2))/2))
abline(0,-3, col=rgb(.6,0,atan(abs(-3))/2))

The scheme in @iadvd's Answer seems very interesting (+1), but I am not familiar with it and wish I could visualize the colors.

BruceET
  • 51,500
  • 1
    thanks, it is a very well known technique for complex numbers. You can even obtain depth from the slope and build autostereograms: https://math.stackexchange.com/q/2426164/189215 – iadvd Dec 15 '17 at 08:00
2

Are you using a step-size for $x$-coordinate? The amount $d$ you increase $x_0$ and then draw the line from $(x_0, f(x_0))$ to $(x_0+d, f(x_0+d))$.

In this case the slope can be between $-\frac{9}{d}$ and $\frac{9}{d}$. You can map it to be a fraction on the interval $[0, 1]$ with the function

$$g(s) = \frac{d}{18} (s+\frac{9}{d})$$

Then it is easy to apply this percentage $t = g(s)$ to get the color. For example, if you want to vary from blue (small values) to red (high values), take the interpolation

$$t(0, 0, 255) + (1-t)(255, 0, 0)$$

I made a little JSFiddle, where this can be tried out. (sMin and sMax are the limits for the slope value). Oops, I made it from red to blue, but that's easy to fix by changing the interpolation end colors to what ever you actually want.

ploosu2
  • 8,707