5

I'm a little baffled by the following:

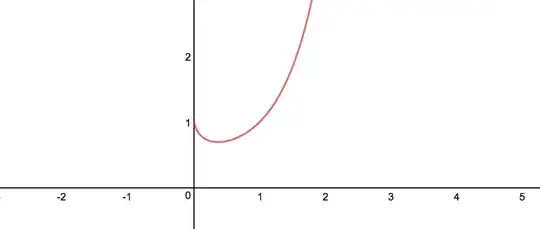
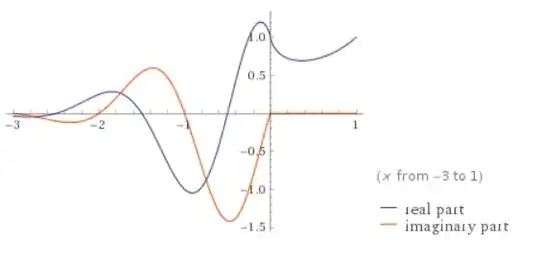
                                      enter image description here

                                                                        Figure 1

This is the graph of $f(x)=x^x$, with its real parts and its imaginary parts shown, and similarly:

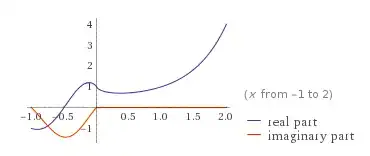
                                              enter image description here

                                                                       Figure 2

so is this, except here obviously only the real part is shown, or is it? I understand that for the values of $\lbrace{x:x\notin\mathbb Z,x<0\rbrace}$, $f(x)$ will have an imaginary part, as there will be some rather severe negative roots in here. Therefore, if we were only plotting the values of $\lbrace{f(x):f(x)\in\mathbb R\rbrace}$, the graph would have discontinuity everywhere besides the isolated points such that $\lbrace{x:x\in\mathbb Z,x<0\rbrace}$ similar to Firgure 1, so why does the graph in Figure 2 not continue for any values of $x < 0$?

In the following video on Blackpenredpen's channel, he mentions that it is because of the need for continuity that we discard values of $f(x)$ such that $x\leq0$, but why is it that we can do this? If we derive the majority of our mathematical understanding from natural occurrences, the graph of $f(x)=x^x$ wouldn't naturally just start at $x=0$, so why is it that we accept this as the standard graph of this function?

                                                   Graph of $y=x^x$ by blackpenredpen

For those of you to whom the video does not snap to the desired time, the bit of the video I'm focusing on is $2:33$.

Any help is appreciated, thank you.
  • $x^x$ has no sensible real value for any $x<0,x\not\in\Bbb Z$. There are no discontinuities there because ${f(x)\mid f(x)\in\Bbb R}$ will have huge gaps below zero. For a beginning, how would you compute $x^x$ for say $x=-\pi$? (I have not looked at the video but I guess something like this is done there). You will not find a real value. – M. Winter Nov 02 '17 at 09:25
  • Why is this a good enough reason to restrict the domain of the function to $\lbrace{ x:x\in\mathbb R,x>0\rbrace}$, though? @M.Winter – joshuaheckroodt Nov 02 '17 at 09:27
  • Maybe two reasons: 1. because you only want to deal with real numbers, 2. there is no preferred answer to what $x^x$ is when $x<0,x\not\in\Bbb Z$. It is the same with $\sqrt x$. You should never apply it to negative numbers, and Yes I say $\sqrt{-1}=i$ is mostly not a good way to do it. But of course you can extend it to negatives. Noone says that defining it for $x>0$ is the only right thing to do. Do what you need for your specific application. (See my answer here) – M. Winter Nov 02 '17 at 09:28

3 Answers3

2

Your Figure 1 doesn't go far enough. It's true that there is no imaginary part at $x=-1$, but there is an imaginary part for $-2<x<-1$ (and $-3<x<-2$ and so on). So if you just plotted the real-valued graph it should have some isolated points at $x=-k$ for $k\in\mathbb N$, but it wouldn't be defined on any interval below $0$.

enter image description here

  • This is something that I've just considered and added to the question, but it still doesn't necessarily explain why we ignore the values of $f(x)$ where $x<0$, since the points where $x\in\mathbb Z,x<0$ are still defined. – joshuaheckroodt Nov 02 '17 at 09:24
  • 1
    You can include those points if you like. But computer graph plotters don't tend to handle isolated points properly because if you're plotting a bunch of points and joining them up, at best you don't have anything to join them to, but normally you'll miss them completely either because you don't try that exact value or because of floating-point arithmetic issues. – Especially Lime Nov 02 '17 at 09:29
2

As other answers already covered, yes, you could include isolated points at negative integers, but usually, we don't like to mix discrete and continuous plotting, and in terms of continuous functions in real numbers, this one is undefined for negative numbers.

Also, once you go into complex numbers, you have to be careful about choosing a branch - there is usually more than one answer and to make it a single-valued function, usually, there is an agreement which one we mean. One example is

$$f(z)=\sqrt{z}$$

In reals, this is defined only for $z\geq 0$, and we define the root to be a positive number. If you extend this to $z<0$, is the imaginary part positive or negative? Recall that $y^2=z$ has two roots: $y=\pm \sqrt{z}$. For positive reals, we chose the plus sign, but for negative, the answer is imaginary, and we have to choose again. What's worse, is that in complex numbers there is no ordering (inequalities don't have meaning), so we again just have to make an agreement.

For you function, it's similar. You can rewrite $$z^z=e^{z \ln z}$$ but the logarithm of negative real numbers is in principle $$\ln z=\ln |z| + \pi i +2\pi i k$$ for any integer $k$. To be fair, the same is true in the positive axis, but there, we choose the branch that is real for all $z$. In the negative, we have no such choice, so plotting the imaginary part implies we arbitrarily chose one of the branches.

With all these ambiguities, we usually just skip the isolated points and say it's undefined in reals, and when we go into the complex plane, we also use a complex argument, so the entire function is complex→complex and we deal with Riemann surfaces which encode the multivalued nature of the solutions. Plotting real→complex rarely makes sense.

orion
  • 15,781
1

If it is your aim to define the real-valued function $x^x$ on a maximal subset of $\Bbb R$, then $\Bbb R^+\cup\Bbb Z\setminus\{0\}$ would probably be the way to go. But most of the time $x^x%$ is considered as a continuous, differentiable or analytic function and hence isolated points are not of interest. What is the right domain for your function depends on your application.

M. Winter
  • 29,928