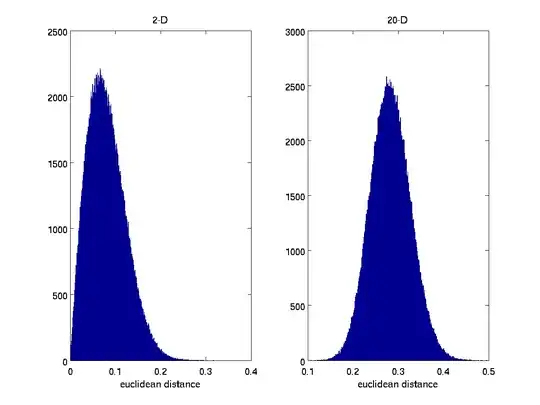
Suppose that I have a random vector $Z = [Z_1,\dots,Z_d]$ where $Z_d \sim \text{beta}(30,30)$ i.i.d. We know that the pdf of this random vector is maximized at $[0.5,\dots,0.5]$. Consider 2 cases, when $d=2$ and $d=20$. I generated samples of $Z$ using Matlab. Using these samples, I computed the euclidean norm of each from $[0.5,\dots,0.5]$ and plotted the histogram of the euclidean norm below, for $d=2$, left, and $d=20$, right.
It is expected that the ranges on the x-axis are different and that the euclidean norms for the 20-D case are larger. But why is the skewness different? The histogram for the 2-D case is more skewed to the right which means that more of its samples are closer to $[0.5,0.5]$. However, the same cannot be said for the 20-D case. It appears that there are fewer samples closer to $[0.5,\dots,0.5]$ than are farther from it which is strange as the pdf is maximum at $[0.5,0.5,\dots,0.5]$...
Can anyone explain how to make sense of this?
