3

I am trying to figure out the formula used to calculate the numbers of the spreadsheet that I just posted.

To summarize, it is the probability of seeing at least (X) consecutive losing trades within a 50-trade period, given a list of defined winning percentages.

I want the formula/model to solve this so I am able to calculate the probabilities with variables of different values.

Example, the probability of seeing at least 15 consecutive losing trades over a 500-trade period, with a theoretical winning percentage of 45%.

Thank you very much to anybody who can help

Em.
  • 15,981
Rob M.
  • 39
  • Next time use mathjax to format mathematical symbols. – Arbuja Apr 29 '17 at 20:32
  • I am not sure that table is correct. For example with a win probability of $90%$, and assuming independence, I think the probability of seeing at least $2$ consecutive losing trades in $50$ is about $36.4%$ rather than the $38.9%$ in the table. Though I may be wrong – Henry Apr 29 '17 at 21:51
  • There is a chance the table is incorrect. It's coming off of a random website I came across, so I'm unsure of who the publisher is and cannot verify his expertise – Rob M. Apr 29 '17 at 23:06
  • Following Python 3 code implements Henry's answer. As a validation, it correctly answers to https://math.stackexchange.com/questions/2147168/probability-of-13-consecutive-failures-in-20000-trials-with-p-4 as well with calc_prob(n_trades=20000, x_loses=13, probability=0.4). def calc_prob(n_trades, x_loses, probability): # Initial values gn = [1] fn = 0 for trade in range(1, n_trades + 1): # Calculate actual G(n) g_num = trade - x_loses gna = probability * (1 - fn) gn.append(gna) gna = gn[g_num] if g_num >=0 else 0 # Calculate actual F(n) fn = fn + ((1 - probability)*x_loses) float(gna) ret – Michal Gow Feb 15 '19 at 12:16

3 Answers3

1

Let's suppose the probability of a winning trade is $p$ and that each trade is independent of the others.

Then setting $F(n)$ as the probability of seeing at least $x$ consecutive losing trades in $n$ total trades and $G(n)$ as the probability of not seeing at least $x$ consecutive losing trades and the $n$th trade being not losing, we would have $$F(n)=F(n-1)+(1-p)^x G(n-x)$$ $$G(n)=\begin{cases} 0 & \text{ when }n <0 \\ 1 & \text{ when }n = 0\\ p (1 - F(n-1)) &\text{ when }n >0 \end{cases}$$ which we can use to create a recurrence in terms of $F$ $$F(n)=\begin{cases} 0 & \text{ when }n < x \\ (1-p)^x & \text{ when }n = x\\ F(n-1)+(1-p)^x p (1 - F(n-x-1)) &\text{ when }n >x \end{cases}$$

So for example with $x=2$ and $p=0.9$ we would get $F(0)=F(1)=0$, $F(2)=(1-0.9)^2= 0.01$, $F(3)= 0.01+(1-0.9)^2\times 0.9\times (1-0) = 0.019$, $F(4)= 0.019+(1-0.9)^2\times 0.9\times (1-0)=0.028$, $F(5)= 0.028+(1-0.9)^2\times 0.9\times (1-0.01)=0.03691$ and so on. This does not quite give the results in your table as it suggests $F(50)\approx 0.36367$ which is not $38.9\%$.

Meanwhile for $x=15$ and $p=0.45$, I think you get $F(500) \approx 0.0275867$

Added:

For large $n$, you can find the asymptotic form as being close to $$F(n) \approx 1-kr^n$$ for suitable $k$ and $r$ depending on $x$ and $p$. In particular, $r$ is the largest real root of $$r^{x+1}−r^x+(1−p)^xp=0$$ (another real root is $1-p$)

For example:

  • with $x=2$ and $p=0.9$
    • $r=\frac{9+\sqrt{117}}{20} \approx 0.99083269132$
    • it seems $ k \approx 1.00847518$
    • so $F(50) \approx 1-1.00847518\times 0.99083269132^{50} \approx 0.36367$
  • with $x=15$ and $p=0.45$
    • $r\approx 0.9999425848$
    • it seems $k \approx 1.00073432$
    • so $F(500) \approx 1-1.00073432\times 0.9999425848^{500} \approx 0.0275867$
Henry
  • 157,058
  • very detailed answer, yet still very easy to understand. I appreciate your help! – Rob M. Apr 30 '17 at 15:47
  • Very interesting and clever your approach to get the recurrence(+1). The results match with the sum formula given in my answer. I would ask you to combine efforts and try and find an asymptotic distribution for large n. – G Cab May 01 '17 at 01:05
  • @GCab I have added some extra thoughts – Henry May 01 '17 at 10:41
0

Consider a sequence of length $s+m$ with $s$ successes and $m$ failures in total.
You know that the number of such sequences is given by ${{s+m} \choose m} $, and that each has a probability of $p^s (1-p)^{m}$ A sequence as above can be considered a binary string of length $s+m$, with $s$ ones in total.

Now you can refer to the answers to this other post [ number of occurrences of k consecutive 1s in a binary string of length n ] (http://math.stackexchange.com/questions/2045496)
where it is explained that

the number of binary strings with $s$ 1's, $m$ 0's, and which contains runs of consecutive 1's of length at most $r$ is given by $$ N_b (s,r,m + 1) = {\rm No}{\rm .}\,{\rm of}\,{\rm solutions}\,{\rm to}\;\left\{ \matrix{ {\rm 0} \le {\rm integer}\;x_{\,j} \le r \hfill \cr x_{\,1} + x_{\,2} + \; \cdots \; + x_{\,m + 1} = s \hfill \cr} \right. $$ where $N_b (s,r,m + 1) $ is expressible by the sum $$ \bbox[lightyellow] { N_b (s,r,m + 1)\quad \left| {\;0 \le {\rm integers }s,m,r} \right.\quad = \sum\limits_{\left( {0\, \le } \right)\,\,k\,\,\left( { \le \,{s \over r}\, \le \,m + 1} \right)} {\left( { - 1} \right)^k \left( \matrix{ m + 1 \cr k \cr} \right)\left( \matrix{ s + m - k\left( {r + 1} \right) \cr s - k\left( {r + 1} \right) \cr} \right)} }$$

So we conclude that
the probability of having at most $r$ consecutive successes in $n$ Bernouilli trials, each with success probability $p$
is given by $$ \bbox[lightyellow] { P_{\,M}(r,p,n) = \sum\limits_{0\, \le \,\,s\,\, \le \,n} {p^{\,s} \left( {1 - p} \right)^{\,n - s} \sum\limits_{\left( {0\, \le } \right)\,\,k\,\,\left( { \le \,{s \over r}\, \le \,n - s + 1} \right)} {\left( { - 1} \right)^k \left( \matrix{ n - s + 1 \cr k \cr} \right)\left( \matrix{ n - k\left( {r + 1} \right) \cr s - k\left( {r + 1} \right) \cr} \right)} } }$$

while instead the probability of having at least $r$ consecutive successes in $n$ Bernouilli trials, each with success probability $p$
(the one you are looking for) is clearly $$ \bbox[lightyellow] { P_{\,L} (r,p,n) = 1 - P_{\,M} (r - 1,p,n) }$$

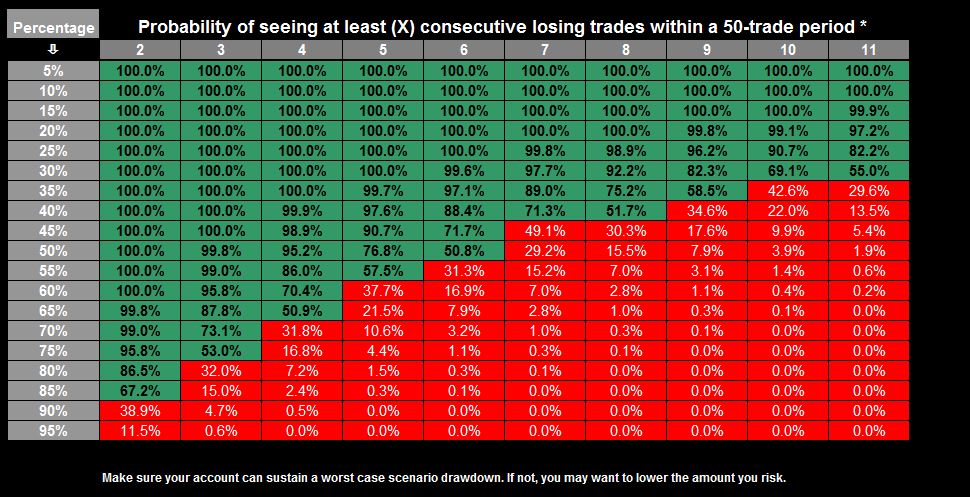
For example, with a win probability of $0.9$ (thus loss $=0.1$) the probability of having at least $2$ consecutive losses (successes) in $50$ tradings will be $$ P_{\,L} (2,0.1,50) = 1 - P_{\,M} (1,0.1,50) = 0.36367... $$ as correctly pointed out by Henry.
Some other values are given in this table (here p = win) $$ \begin{array}{l} P_{\,L} (r,\;1 - p,\;50) \\ \begin{array}{c|ccc} \hline {p\backslash r} & & 2 & 3 & 4 \\ \hline {0.3} & & {1.0} & {1.0} & {0.9978} \\ {0.5} & & {1.0} & {0.9827} & {0.8274} \\ {0.8} & & {0.8202} & {0.2707} & {0.059} \\ {0.9} & & {0.3634} & {0.0425} & {0.0042} \\ \end{array} \\ \end{array} $$ Also, putting $r=2 \; p (win)=0.9$ and $n=0,1,2,..$, it is easy to check that we obtain the values already indicated by Henry at the end of his answer.

And to satisfy your curiosity, $P_{\,L} (15,\;0.55,\;500) = 0.0275867...$ again confirming Henry's answer. However, for large $n$ an asymptotical formula would be needed, which at the moment I did not succeed and find.

G Cab
  • 35,272
0

Here's some possibly-not-perfectly-Pythonic Python code to generate the table in a comma-separated-value format that you can load into common spreadsheet tools such as Excel. This also produces columns for $X=0$ and $X=1.$ Of course the probability in the $X=0$ column will always be $1$ (or very nearly $1,$ depending on how the roundoff errors add up).

def probability_list(p_success, max_failures, n_trials):
    # Returns a list of the probabilities of at least k failures
    # in n trials for k = 0..max_failures.

    p_failure = 1.0 - p_success

    # p_state[i][j] will be the probability that we currently have j
    # consecutive failures and the high-water mark is i consecutive failures.
    p_state = []
    for i in range(max_failures):
        p_state.append([0.0] * (i+1))
    p_max_failures = 0.0

    # Initially, we have never had any consecutive failures
    p_state[0][0] = 1.0

    for t in range(n_trials):
        new_p_state = []
        for i in range(max_failures):
            new_p_state.append([0.0] * (i+1))
        # Put the probabilities at time t+1 in new_p_state
        new_p_state[0][0] = p_success * p_state[0][0]
        for i in range(1, max_failures):
            new_p_state[i][0] = p_success * sum(p_state[i])
            for j in range(1, i + 1):
                new_p_state[i][j] = p_failure * p_state[i][j - 1]
            new_p_state[i][i] += p_failure * p_state[i - 1][i - 1]
        p_max_failures += p_failure * p_state[max_failures-1][max_failures-1]
        p_state = new_p_state

    # cum_p_highwater[i] will be the probability there were at least i
    # consecutive failures.
    cum_p_highwater = [0.0] * (max_failures + 1)
    cum_p_highwater[max_failures] = p_max_failures
    for i in range(max_failures - 1, -1, -1): # count down to zero
        cum_p_highwater[i] = sum(p_state[i]) + cum_p_highwater[i + 1]
    return cum_p_highwater

max_failures = 11
n_trials = 50

print ('p,', ','.join(str(n) for n in range(max_failures + 1)))

for k in range(1, 20):
    p_success = k * 0.05
    list_p = probability_list(p_success, max_failures, n_trials)
    print (p_success, ',', ','.join(str(p) for p in list_p))

The principle of this table is that it computes a probability distribution over the longest losing sequence seen so far and the length of the current losing sequence, starting at zero trades executed and computing the probabilities after each additional trade from the probabilities before that trade.

The results of this script agree with a result from at least one other answer to this question and with other results I obtained from yet other calculations. They do not agree with the table from the website. I think that table is either calculated badly or is based on assumptions that are unknown to us.

David K
  • 98,388
  • Thank you for the code! The table is most likely wrong since now 3 people have said it to be incorrect. I appreciate people like you and the others on this post who are much more intelligent than I am and help out! – Rob M. Apr 30 '17 at 13:31