It seems that A---B might have forgotten about this question, but as someone who used to play with graphing calculators as well around your age, I admire your enthusiasm and would be happy to pick up where they left off!
I don't want to confuse you with exactly why the following is true, but I'll be happy to explain more if you'd like, and as you continue learning more mathematics, you'll understand it soon enough.
Simply put, to rotate any graph in the $xy$-plane by an angle $\phi$, make the following substitutions:
$$\begin{align}
x &\mapsto x\cos\phi-y\sin\phi \\
y &\mapsto x\sin\phi+y\cos\phi
\end{align}$$
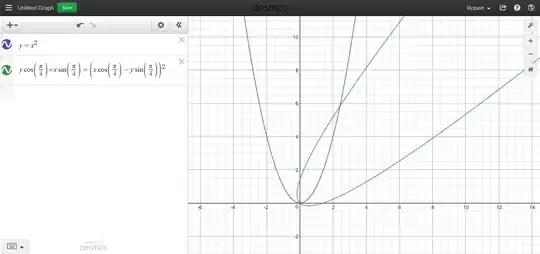
As for what this would look like in practice, say you wanted to rotate the graph of $y=x^2$ by $45^{\circ}$. To graph both the original parabola and the rotated parabola, you would enter the following into Desmos:
$$\begin{align}
y&=x^2 \\
x\sin\left(\frac{\pi}{4}\right)+y\cos\left(\frac{\pi}{4}\right)&=\left(x\cos\left(\frac{\pi}{4}\right)-y\sin\left(\frac{\pi}{4}\right)\right)^2
\end{align}$$
I've converted the angle $45^{\circ}$ into radians here, because that's just the way Desmos wants it; are you familiar with radians?
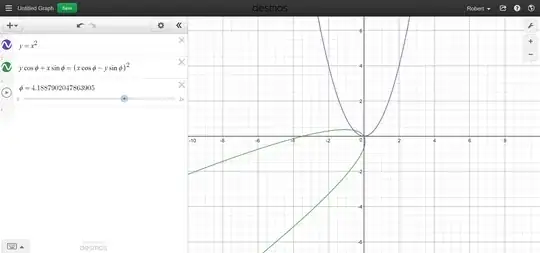
Anyway, lo and behold, we end up with the following graph:
For even more fun with rotating graphs, you can just leave $\phi$ (phi) in the equation, add a slider for it when prompted, and drag it around to watch what happens!