0

So, the problem I have is setting up a function to draw a line. This is not a programming problem as I do have that solved, its how I setup a formula for drawing the graph.

So, I have the following:

  • width (W) of the window eg: 500
  • height (H) of the window eg: 500
  • xmin (X0) eg: -10
  • xmax (X1) eg: 10
  • ymin (Y0) eg: -10
  • ymax (Y1) eg: 10

and I have the function f(x) = x^2.

Now when I try to draw the graph using what is setup right now it does not work:

graph

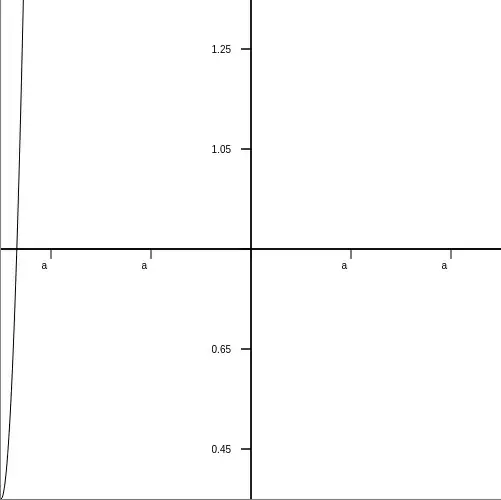
Ignore the ticks, those are not accurate, still being programmed properly.

Now as you can see the function is not drawn properly. I need to stretch it and translate it properly. I have not obtained a formula that works. The examples are what i am testing with but needs to use the constants above for any size window, and any zoom of the window. Here is what I tried and how it should work

This should give me my x shift: $$ x_{shift} = W\frac{|x_{0}|}{x_{1}-x_{0}} $$

This should give me my y shift: $$ y_{shift} = H\frac{|y_{0}|}{y_{1}-y_{0}} $$

This should be my x stretch: $$ x_{stretch} = i\frac{x_{1}-x_{0}}{W}+x_{0} $$

This should be my y stretch: $$ y_{stretch} = i\frac{y_{1}-y_{0}}{H}+y_{0} $$

Where i is a value from 1 to W in the loop

And when I draw a point it should be like so: $$ (i, H - (y_{stretch}f(x_{stretch}i-x_{shift})+y_{shift})) $$

I tried this: $$ (i, H - (y_{stretch}f(\frac{1}{x_{stretch}}i-x_{shift})+y_{shift})) $$

But this gets me something I could see that is starting to work: $$ (i, H - (y_{stretch}f(i-x_{shift})+y_{shift})) $$

H - f(x) is necessary as the program draws from 0,0 in the top left corner, not the bottom left corner, its a correction to Cartesian.

which makes this: (I zoomed to x0=-1, x1=1, y0=-1, y1=1) if it worked it should curve from the very top left corner to the very center to the top right corner.

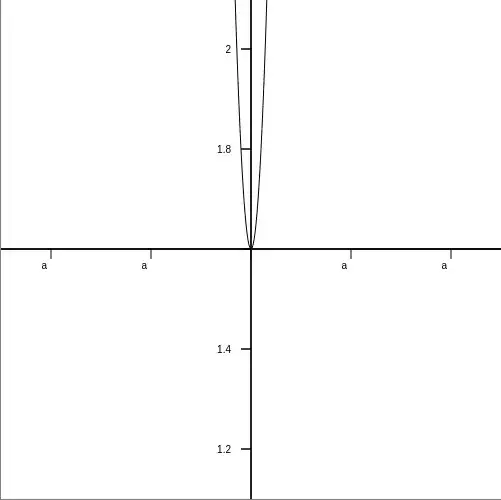
EDIT: SOLUTION All thanks goes to amd, read his answer for full detail. This is a very short summary. His working formula:

$$ y' = -{H\over y_1-y_0}\left(f\left({x_1-x_0\over W}i+x_0\right)-y_1\right) $$

Is used in Javascript using CTX to draw to canvas like so:

  //        v          |2       2|        |4  |6               6|           4|        v
  ctx.lineTo(i, -( H / ( y1 - y0 ) ) * ( f( ( ( ( x1 - x0 ) / W ) * i ) + x0 ) - y1 ) );
  //        ^    |1               1|   |3   |5  |7       7|          5|            3| ^

Comments above and below the line is make reading brackets easier.

Graph 2

Drew
  • 155
  • So, are you basically trying to shift and stretch the rectangular region $[x_0,y_0]\times[x_1,y_1]$ into a $W\times H$ viewport in which $y$ increases down the page/screen? – amd Dec 26 '16 at 22:48

1 Answers1

1

You’re looking for an affine transformation that maps the rectangle $[x_0,y_0]\times[x_1,y_1]$ to the rectangle $[0,W]\times[0,H]$, taking into account that the $y$-axis gets flipped in the process. This transformation thus has to make the following mappings: $$\begin{align}(x_0,y_0)&\mapsto(0,H) \\ (x_0,y_1)&\mapsto(0,0) \\ (x_1,y_0)&\mapsto(W,H) \\ (x_1,y_1)&\mapsto(W,0).\end{align}$$ Any three of these mappings are sufficient to determine the affine transformation; the fourth will follow by linearity. A general affine transformation is of the form $$\begin{align}x'&=ax+by+c\\y'&=dx+ey+f,\end{align}$$ but since there’s no rotation or skew involved, we know that $b=d=0$. You can then use the above mappings to set up a system of linear equations and solve them for the remaining coefficients. For instance, the first mapping gives us the equations $ax_0+c=0$ and $ey_0+f=H$, so $c=ax_0$ and $f=H-ey_0$. Continuing with the other mappings and substituting the results into successive equations, you’ll eventually find all six unknown coefficients.

I prefer to work directly with matrices in homogeneous coordinates, though. Using the first three mappings and the fact that the columns of a transformation matrix are the images of the basis, we get the matrix $$\pmatrix{0&W&0\\0&H&H\\1&1&1}.$$ This matrix is not expressed relative to the standard basis, however, so we have to right-multiply it by a change-of-basis matrix: $$\pmatrix{0&W&0\\0&H&H\\1&1&1}\pmatrix{x_0&x_1&x_0\\y_1&y_0&y_0\\1&1&1}^{-1}.$$ Notice that the columns of the matrix being inverted are the three source points of the known mappings. We know that the three points, being the corners of a rectangle, aren’t colinear, so the second matrix is invertible. The resulting matrix is $$T=\pmatrix{{W\over x_1-x_0} & 0 & -{W\over x_1-x_0}x_0 \\ 0 & -{H\over y_1-y_0} & {H\over y_1-y_0}y_1 \\ 0&0&1},$$ so the transformation you’re looking for is $$\begin{align}x' &= {W\over x_1-x_0}x-{W\over x_1-x_0}x_0 \\ y' &= -{H\over y_1-y_0}y+{H\over y_1-y_0}y_1.\end{align}$$ The denominators are just the width and height of the source region, so we can rewrite this as $$\begin{align}x' &= {W_{\text{dst}}\over W_{\text{src}}}(x-x_0) \\ y' &= -{H_{\text{dst}}\over H_{\text{src}}}(y-y_1).\end{align}$$ This looks plausible: the transformation shifts the top left corner $(x_0,y_1)$ of the source rectangle to the top left of the viewport and then stretches/shrinks the the region by the ratios of the respective destination and source sides, leaving that point fixed and flipping the $y$-axis in the process.

For your drawing loop, you’ll need the inverse of this mapping, which isn’t too hard to compute given the last pair of equations. You just perform the steps in the opposite order: first rescale, and then shift the origin. That is, $$x = {W_{\text{src}}\over W_{\text{dst}}}x'+x_0 = {x_1-x_0\over W}x'+x_0$$ and similarly for $y$. Putting this all together, to plot a point on the graph of a function $f$, you back-map the viewport $x$-coordinate, apply $f$ to that, and then map the resulting $y$ value to the viewport, i.e., the viewport coordinates of the point to plot are: $$\begin{align} x'&=i \\ y' &= -{H\over y_1-y_0}\left(f\left({x_1-x_0\over W}i+x_0\right)-y_1\right). \end{align}$$

amd
  • 53,693
  • This worked perfectly, thank you. Ill post an edit with your formula in working code for those interested. – Drew Jan 03 '17 at 06:51