This question continues the previously asked question which is solved by @joriki.
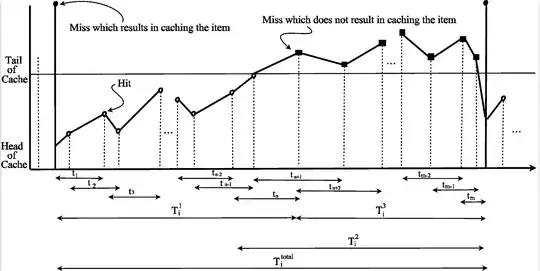
As you can see in the figure, there is cahce which I refered as system in question. Data item $i$ is requested by users. The request arrivals have a Poisson distribution with parameter $\lambda$ as the mean of distribution. Item $i$ gets/remains stored in the cache if and only if the time period between $l-1^{th}$ and $l+1^{th}$ requests for it, depicted by $t_l$ in the figure, is less than $\tau$ (i.e. $t_l<\tau$ for $1\le l < n$). Item $i$ is evicted from the cache as soon as $t_n>\tau$. The time period between the beginning of $t_1$ and end of $t_n$ is depicted by $T_i^1$. To calculate $T_i^1$, we can say that we have a sequence of random variables that are independently identically exponentially distributed with parameter $\lambda$. We sum them until two consecutive values add up to at least $\tau$ (with the values that causes item $i$'s eviction from the cache). $E[T_i^1]$ is calculated by @joriki as an answer to question.
next requests for item $i$ does not lead to storing it in the cache as long as $t_l > \tau$ for $n < l < m$. Item $i$ is actually gets stored again in cache as soon as $t_m<\tau$. To get the expected value of time period between the beginning of $t_n$ and end of $t_m$, depicted by $T_i^2$ (as shown in the figure), we can say that we have a sequence of random variables that are independently identically exponentially distributed with parameter $\lambda$. We sum them until two consecutive values add up to up to $\tau$ (with the values that causes item $i$ to return to the cache). $T_i^3$, which is the mean time required for item $i$ to get cached back after its eviction, could be easily calculated as follows: $E[T_i^3] = E[T_i^2] - E[t_n] = E[T_i^2] -\frac{2}{\lambda}$
What I am looking for is $E[T_i^2]$ as well as $E[T_i^{total}]$.
