Over at stack overflow I asked a question about how to plot the Riemann zeta zero spectrum from the von Mangoldt function. Then I asked a question about calculating the Riemann zeta function at the critical line with the Fourier transform of a exponential sawtooth function by building upon Heike's answer. After experimenting with anon's answer I believe I plotted the Riemann zeta function at the critical line here at my blog times/divided by a scale factor. By then going back to the beginning I modified the transform as in anon's answer and applied it to the von Mangoldt function and got a zeta zero spectrum plot which appears to have spikes of equal amplitude.
The Mathematica program for the plot looks like this:
Clear[f]
scale = 1000000;
f = Range[scale];

f[[1]] = N@MangoldtLambda[1];
Monitor[Do[
  f[[i]] = N@MangoldtLambda[i] + f[[i - 1]], {i, 2, scale}], i]

xres = .002;
xlist = Exp[Range[0, Log[scale], xres]];
tmax = 60;
tres = .015;
s = 1/2;
Monitor[errList1 =
   Table[((xlist^(-s + I t).(f[[Floor[xlist]]] - xlist)))*(s +
       I t), {t, Range[0, 60, tres]}];, t]

Print["Variant of the Fourier transform of the von Mangoldt function"]
g1 = ListLinePlot[Re[errList1]/Length[xlist], DataRange -> {0, 60},
   PlotRange -> {-.3, 1.3}, Axes -> True, Filling -> Axis];
g2 = Graphics[Line[{{0, 1}, {60, 1}}]];
Show[g1, g2, ImageSize -> Large]
And the output looks like this:
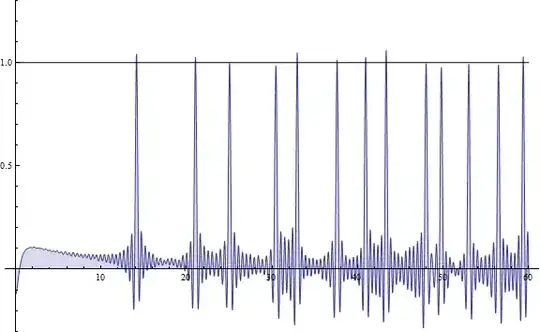
My question is: Are the amplitudes of the frequency spikes equal to $1$ (the upper black line) when the real part of the complex number $s$ is equal to $1/2$?
The matrix formulation of this transform, which is a variant of the Fourier transform, usually gives an a bit un-even output so I guess the answer could be positive.
Edit 23.7.2012:
The program I believe does something like this:
$$\displaystyle X_t = \frac{1}{length(x)} \sum\limits_{x=0}^{x=\log(scale-1)} (e^{x})^{-1/2 + i t} \cdot (f(\lfloor e^{x}\rfloor)-e^{x})) \cdot (-1/2 + i t)$$
This second plot is the same as from the program above except that here the multiplicand in the program was $(-1/2 + i t)$ instead of $(+1/2 + i t)$. This gives a different beginning of the plot.
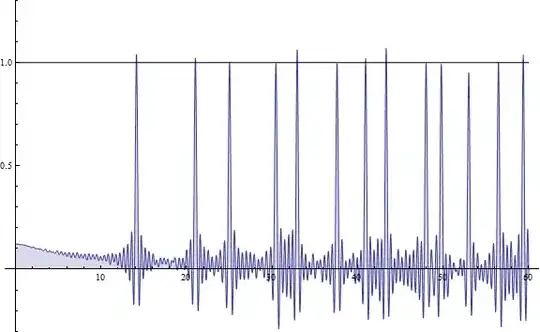
where $\displaystyle X_t $ should be the graph in the plot.
Edit 23.7.2012:
In the formula above $f$ should be:
$$\displaystyle f = \sum\limits_{n=1}^{n=k} \Lambda(n)$$
where $\Lambda(n)$ is the von Mangoldt function:
Log(1), Log(2), Log(3), Log(2), Log(5), Log(1) ...