Interpolation = discrete-to-continuous conversion
Interpolation is used to reconstruct a continuous signal from a few discrete samples, a technique known as digital to analog conversion. While a discrete signal is undefined except at a few points in time (samples), the reconstructed signal is known at any time point. Thus some form of interpolation is required to fill the undefined values between samples.
Sinc function = spectrum of a rectangular function
Interpolation can be done in many ways. The particularity of the sinc interpolation is it's the only one mathematically perfect.
A function can be reformulated as a spectrum using a Fourier transform. For the rectangular function (boxcar function) the spectrum is a sinc pulse. This sinc spectrum contains an infinity of harmonics, though their amplitude rapidly decays.
Convolution with sinc pulses
What we want to do to reconstruct the signal is a convolution between the samples and scaled and shifted versions of sinc.
This technique is known as Whittaker–Shannon interpolation: "This is equivalent to filtering the impulse train with an ideal (brick-wall) low-pass filter with gain of 1 (or 0 dB) in the passband. If the sample rate is sufficiently high, this means that the baseband image (the original signal before sampling) is passed unchanged and the other images are removed by the brick-wall filter."
Method
Can anyone explain plainly how to do sinc interpolation?
Three steps are required to perform a sinc interpolation on discrete samples:
Create sinc pulses, one per sample, centered on the sample. As said sinc pulses have an infinite width, but the practical width will be limited to the signal duration. A sinc pulse is a continuous function, defined at any time, with a maximum amplitude of 1.
Multiply each pulse by the value of the sample. While the value of an isolated sinc pulse is accurate at only one instant, it contributes to the values at other instants.
Add all delayed and scaled sinc pulses.
*Example
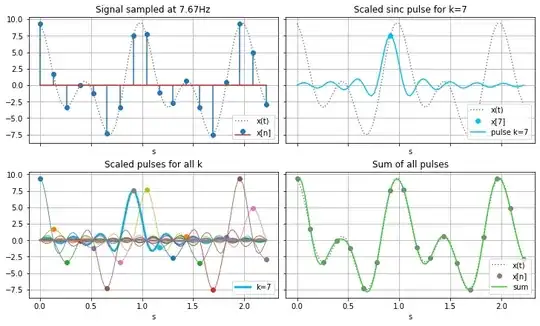
Top-left: The continuous-time (unknown) signal and the known discrete samples.
Top-right: The sinc pulse created for sample 7 (8th sample). The pulse has its peak amplitude equal to the sample value (7.5). Other values are not correct but contribute to the final sum.
Bottom-left: 18 sinc pulses, each one delayed to match a given sample time, and scaled to match the sample value.
Bottom-right: All sinc pulses summed. Since pulses are continuous, the sum is defined at any time, not only at sampling times. The dotted curve is the original continuous-time signal, the dots are the samples, and the plain curve is the interpolation.
The sample signal shown above is a sum of two sinusoids: f(t) = 5 cos(2π f t + 3π/7) + sin(2π f/2 t + 9π/7) with f=2Hz. It would work the same for any number of sinusoids in the signal, as long as the greatest frequency doesn't exceed half the sampling rate (7.6Hz/2)
Actual use of sinc interpolation
Why it's useful?
It is useful when you are provided these samples:
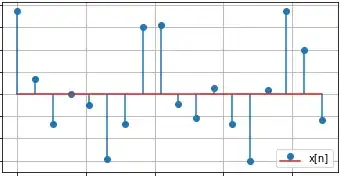
and asked to reconstructed the original continuous signal between samples.
Any periodic signal, even very complex, can be broken down into sinusoids (using the Fourier transform or any other equivalent transform). According to Shannon sampling theorem, it's possible to perfectly reconstruct the details of any waveform if there are at least two samples per period for the sinusoid with the greatest frequency in the signal. This perfect reconstruction requires sinc pulse interpolation.
The tiny difference in the picture above is because the number of samples used is finite. Pulses before the first sample, and after the last sample are not created, thus are ignored in the sum.
Reconstruction is needed to convert a digital signal to an analog version. For example this is required to play a CD track which is only a collection of discrete amplitudes at given times, while the loudspeakers need to be driven by a continuous waveform.
While this perfect reconstruction is nice, still most conversions, including for a CD player, is done with other interpolating pulses, often staircase steps. This is easier (less expensive) and the difference is practically not perceived by the audience.

