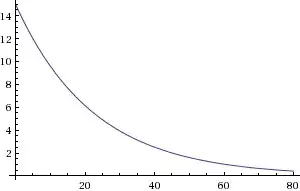
I've got a graph image, but I need the formula used the create this graph. This image is being used to read the result corresponding values manually, but I want to automate this by using a formula.
The X axis is a known value 'som van de faktoren', the Y axis 'tijd in jaren' should be the resulting value.
The only value that is 100% sure is 0 (x) = 15 (y). However, as you can see 5 (x) = 12 (y) should be 99% correct too.
Is it possible to connect a formula based on the visual graph? I'm both curious for the formula as for the way of resolving it :-)
I'm not allowed to post images yet, so here is a url to the graph; https://www.dropbox.com/s/5u2vq6i5s0ld84x/Screenshot%25202015-07-13%252012.57.56.png?dl=0