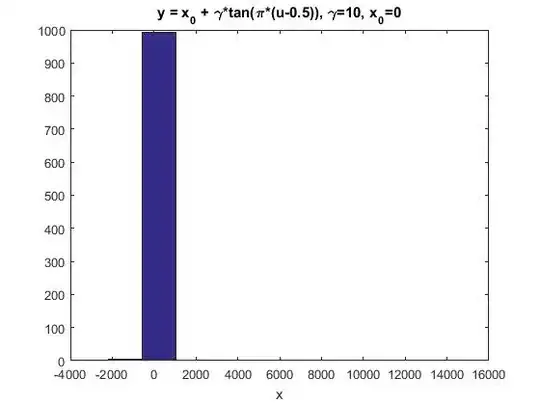
First, as others have mentioned, you're using the default settings for the hist function. As stated right at the beginning of the documentation, this uses 10 equally-spaced bins by default. Try increasing the number:
gam = 10;
x0 = 0;
u = rand(1,1e4);
r = x0 + gam.*tan(pi*(u-0.5));
hist(r,1e3);
axis([-2000 2000 0 1e4]);
The vertical (dependent) axis is in terms of bin counts as this is a histogram, not a probability density function (PDF) plot. However, just being able to specify the number of bins is not very flexible. This one of several reasons why The MathWorks discourages the use of hist and the underlying histc in current versions of Matlab.
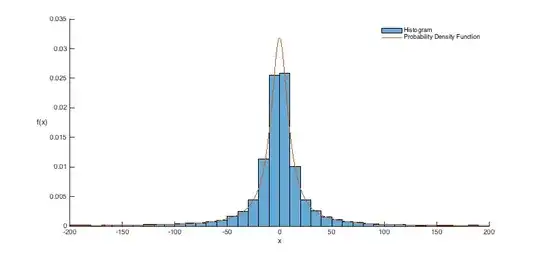
A better, more-flexible alternative is the histogram function, which does a better job of automatic binning even without specifying any additional settings. Additionally, it has options for easily normalizing the histogram as if it were a PDF, if that's what you're after
gam = 10;
x0 = 0;
u = rand(1,1e4);
r = x0 + gam.*tan(pi*(u-0.5));
edges = -200:10:200;
histogram(r,edges,'Normalization','pdf');
hold on;
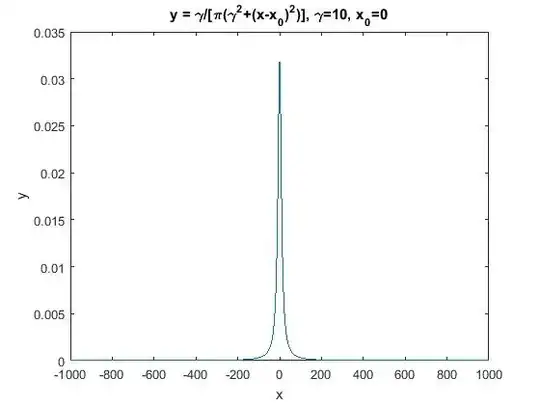
x = -200:0.01:200;
y = (1/pi)*(gam./(gam^2+(x-x0).^2));
plot(x,y);
axis([x(1) x(end) 0 1.1*max(y)]);
This produces a plot like this:
Lastly, you can use kernel density estimation via Matlab's ksdensity function:
gam = 10;
x0 = 0;
u = rand(1,1e3);
r = x0 + gam.*tan(pi*(u-0.5));
x = -200:0.01:200;
y = (1/pi)*(gam./(gam^2+(x-x0).^2));
f = ksdensity(r,x);
plot(x,y,'r--',x,f,'b');
axis([x(1) x(end) 0 1.1*max(y)]);
which yields a plot something like this:
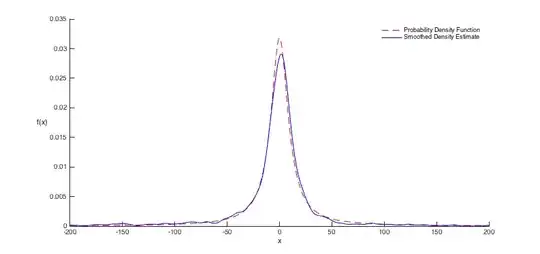
More random samples will result in smoother estimates that match your PDF more closely. Be sure to read through the documentation for ksdensity.