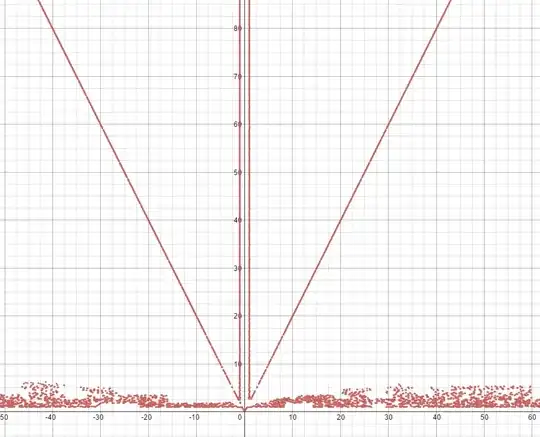
Why does the graph of $y=\gcd \left(\frac{x}{y},xy\right)$ seem to have 4 "straight" lines?
Using https://www.desmos.com/calculator for plotting.
Why does the graph of $y=\gcd \left(\frac{x}{y},xy\right)$ seem to have 4 "straight" lines?
Using https://www.desmos.com/calculator for plotting.
This is due to some bad software and/or asking software to do something it wasn't meant to do.
Suppose $y=\gcd(x/y,xy)$. Then $y$ must divide $x$, else $x/y$ is not an integer, and the gcd would not be defined.
Say $x=yk$ for some integer $k$.
Then $x/y$ = $k$, and $\gcd(x/y,xy)=\gcd(k,y^2 k) = k$.
So $k=y$, i.e., $x=y^2$.
In fact, $y=\gcd(x/y,xy)$ if and only if $x=y^2$.
So, for example, you should see the points $(1,1)$, $(4,2)$, $(9,3)$, etc., in the plot. That's all that should be there.
However, the software is not smart enough to conclude this, so it does some kind of shotgun approach on your implicit equation, and as String commented, there must be some rounding in order for it to make sense of $x/y$ when it is not an integer. Then it tries to "connect the dots". The result is it gives you lots of points that are not solutions (i.e., nonsense), while leaving out the points that are solutions (since there are no nearby solutions, and it can't check everywhere).