46

On average, how many times must I roll a dice until I get a $6$?

I got this question from a book called Fifty Challenging Problems in Probability.

The answer is $6$, and I understand the solution the book has given me. However, I want to know why the following logic does not work: The chance that we do not get a $6$ is $5/6$. In order to find the number of dice rolls needed, I want the probability of there being a $6$ in $n$ rolls being $1/2$ in order to find the average. So I solve the equation $(5/6)^n=1/2$, which gives me $n=3.8$-ish. That number makes sense to me intuitively, where the number $6$ does not make sense intuitively. I feel like on average, I would need to roll about $3$-$4$ times to get a $6$. Sometimes, I will have to roll less than $3$-$4$ times, and sometimes I will have to roll more than $3$-$4$ times.

Please note that I am not asking how to solve this question, but what is wrong with my logic above.

Thank you!
Roby5
  • 4,287
Sidd Singal
  • 3,452
  • Could you explain more about "I want the probability of there being a $6$ in $n$ rolls being $1/2$ in order to find the average", it's a bit confusing. – Vladimir Vargas Jan 26 '15 at 03:28
  • 2
    The average is the expectation or mean of the number of tries; the "average" you are trying to find is generally called the median. – Dilip Sarwate Jan 26 '15 at 03:30
  • @VladimirVargas Thanks for the reply. I am still a little bit confused with a concept of an "average" I think. But with that sentence, I was implying that the average number of rolls will be such that the probability of there not being a 6 in those number of rolls will be 1/2. I am not sure if that clarifies anything but I am not entirely sure how else to explain it. – Sidd Singal Jan 26 '15 at 03:32
  • I don't understand why you look for the probability of having no $6$ to be $1/2$. I will post an answer anyway. – Vladimir Vargas Jan 26 '15 at 03:37
  • @DilipSarwate Maybe that is why I am not thinking about this right. I thought about what you said a bit harder and I think I understand now. I feel like a dumbass now ahaha...Thanks! – Sidd Singal Jan 26 '15 at 03:38
  • On average, how many times do you have to toss a coin before it comes up heads? The probability of getting heads in $1$ toss is $1/2$, but I think you'll agree that the average number of tosses will be greater than $1$. (It can be more than $1$ but it can't be less than $1$.) – bof Jan 26 '15 at 04:16
  • 10
    @mathguy Another way to see why your logic is wrong is to realize that each number should have an equal chance of showing up. So if you expect to see a 6 in 3-4 throws, you should expect every other number as well, and there's too many of them. – Luka Horvat Jan 26 '15 at 08:49
  • @LukaHorvat That is a good point. – turkeyhundt Jan 26 '15 at 09:11
  • @LukaHorvat: It's somewhat imprecise, though. For instance, I could "intuively" say that I expect a number to show up when "p>=0.5" which would imply 3 throws. The question as worded is better worded. (Although: what set am I averaging over?). Still, the idea is solid. A more accurate formulation would define the number of expected sixes after n throws as E6(n) and ask us to find the smallest n for which E6(n) >= 1.0. Now clearly E6(n)=E1(n) and sum(i=1..6) Ei(n)=n – MSalters Jan 26 '15 at 14:51
  • 2
    @mathguy's expectation was my first intuition, too. My reasoning was that the probability of rolling something other than a six, n times in a row, was (5/6)^n. If that quantity is less than 50%, the chances of rolling a 6 must be higher than the chances of not rolling a 6. Thus log(0.5)/log(5/6) ~= 3.8. – AshleyZ Feb 23 '17 at 21:54

6 Answers6

20

You can calculate the average this way also.

The probability of rolling your first $6$ on the $n$-th roll is $$\left[1-\left(\frac{5}{6}\right)^n\right]-\left[1-\left(\frac{5}{6}\right)^{n-1}\right]=\left(\frac{5}{6}\right)^{n-1}-\left(\frac{5}{6}\right)^{n}$$

So the weighted average on the number of rolls would be $$\sum_{n=1}^\infty \left(n\left[\left(\frac{5}{6}\right)^{n-1}-\left(\frac{5}{6}\right)^{n}\right]\right)=6$$

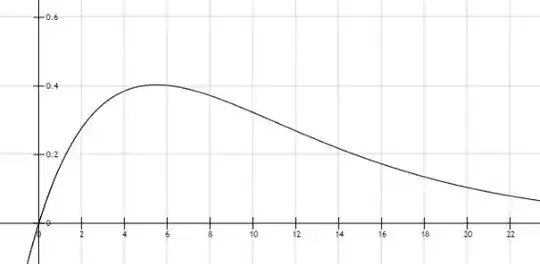
Again, as noted already, the difference between mean and median comes in to play. The distribution has a long tail way out right pulling the mean to $6$. enter image description here

For those asking about this graph, it is the expression above, without the Summation. It is not cumulative. (The cumulative graph would level off at $y=6$). This graph is just $y=x\left[\left(\frac{5}{6}\right)^{x-1}-(\left(\frac{5}{6}\right)^{x}\right]$

It's not a great graph, honestly, as it is kind of abstract in what it represents. But let's take $x=4$ as an example. There is about a $0.0965$ chance of getting the first roll of a $6$ on the $4$th roll. And since we're after a weighted average, that is multiplied by $4$ to get the value at $x=4$. It doesn't mean much except to illustrate why the mean number of throws to get the first $6$ is higher than around $3$ or $4.$

You can imagine an experiment with $100$ trials. About $17$ times it will only take $1$ throw($17$ throws). About $14$ times it will take $2$ throws ($28$ throws). About $11$ times it will take $3$ throws($33$ throws). About $9$ times it will take $4$ throws($36$ throws) etc. Then you would add up ALL of those throws and divide by $100$ and get $\approx 6.$

turkeyhundt
  • 7,733
  • 1
    For those of us learning more about probability, can you explain this bottom graph? Exactly what does it represent? Is that cumulative probability of obtaining a six roll given X dice throws? What is the vertical axis, what is the horizontal axis? Are those numbers accurate, or are they there just to give shape to the curve? Color me very confused. Thank you for the help. – zipzit Jan 26 '15 at 06:04
  • 1
    I will add to my answer. – turkeyhundt Jan 26 '15 at 06:21
  • I apologize for my ignorance. I'm thinking the probabably of rolling (at least) one six is simply n/6 where n = # of times the dice is thrown (1/6 + 1/6 + 1/6 +1/6 =4/6 for the probability that a six is thrown within four dice throws) I know I should be getting this, but that 0.965 number seems too high. I do thank you for your submit (and time!) – zipzit Jan 26 '15 at 06:41
  • It was a typo. I've changed it to 0.0965. ($\frac{5}{6}\cdot\frac{5}{6}\cdot\frac{5}{6}\cdot\frac{1}{6}\approx0.0965)$ As the only way to get the first 6 on the 4th throw is to not throw a 6 three times and then throw a 6. – turkeyhundt Jan 26 '15 at 06:43
  • 1
    Work out the expected value - you're so close! – Alec Teal Jan 26 '15 at 09:09
  • Is the graph a sort of histogram showing how many series of rolls will end after x rolls? – Moss May 29 '16 at 07:10
  • @Moss Not quite. It is a histogram, but at each value of $x$, you multiply the histogram value by $x$. Since the original question was asking the expected number of rolls, it shows the probability of it taking $x$ rolls, multiplied by $x$ for sort of a weighted histogram. – turkeyhundt May 29 '16 at 23:58
  • Isn't the probability of rolling your first 6 on the $n$-th roll is $\left(\frac{5}{6}\right)^{n-1} \cdot \left(\frac{1}{6}\right)$ – kelalaka Jan 12 '21 at 19:42
  • Yes @kelalaka. My first equation in the answer does reduce to that. Here 6 years later I don't remember why I was thinking that was a better form, but they are equivalent. – turkeyhundt Jan 13 '21 at 20:04
  • I couldn't find the logic behind it either, so hit a comment. Actually, Roberto's answer pinpoints Geometric distribution which is the educative answer. – kelalaka Jan 13 '21 at 20:07
16

The probability of the time of first success is given by the Geometric distribution.

The distribution formula is:

$$P(X=k) = pq^{n-1}$$

where $q=1-p$.

It's very simple to explain this formula. Let's assume that we consider as a success getting a 6 rolling a dice. Then the probability of getting a success at the first try is

$$P(X=1) = p = pq^0= \frac{1}{6}$$

To get a success at the second try, we have to fail once and then get our 6:

$$P(X=2)=qp=pq^1=\frac{1}{6}\frac{5}{6}$$

and so on.

The expected value of this distribution answers this question: how many tries do I have to wait before getting my first success, as an average? The expected value for the Geometric distribution is:

$$E(X)=\displaystyle\sum^\infty_{n=1}npq^{n-1}=\frac{1}{p}$$

or, in our example, $6$.

Edit: We are assuming multiple independent tries with the same probability, obviously.

  • 1
    Could you please explain how the final summation value came out to be 1/p? – user1995 Oct 08 '17 at 13:46
  • In the first expression, I think the K should be n, but it won't let me edit since it's only a single character change. – PurpleVermont Apr 20 '21 at 23:57
  • 1
    @user1993 it is explained in this page. The crux of the argument hinges on the identity $n(1-p)^{n-1} = \frac{d}{dp} (1-p)^n$ (note normally we read this equality from right to left, but it obviously still holds in reverse as equality is a symmetric relation). Absorbing the factor n into the power then lets you turn the sum into a closed form analytic function via $\sum_{n=0}^\infty (1-p)^n = 1/p$. – Zxv Dec 16 '21 at 00:08
13

Your calculation is almost correct, but it's calculating the wrong thing.

${(5/6)}^{n-1}$ is the probability that you roll any other number at least $n$ times until rolling a six. Setting this to $1/2$ gives:

$$n = \frac{-1}{\log_2 (5/6)}+1$$

This is the median of the distribution: the numerical value separating the higher half of the distribution from the lower half.

It is not the mean (average).

Graham Kemp
  • 129,094
12

The experiment is: roll a die until you get a six.

The median is $3.8:$ That means that half the time when you perform this experiment you will get your six in under $3.8$ rolls and half the time you won't.

The expected value is $6.$ This means that if you performed the experiment a hundred times and added all the rolls from each experiment together you should get around $600$ total rolls. So one could get the same total by assuming we had $6$ rolls in each experiment.

Think of it like this: although you have a $50\%$ chance of it taking less than $3.8$ rolls there are still gonna be a lot of times where it takes $8, 9, 10$ or more. Those high numbers are going to skew your expected values and leave you with an average of $6.$

The question you asked is a good one and goes right to the heart of what we mean by expected value.

Roby5
  • 4,287
8

The probability of something happening in n rolls might be 1/2, and that number might be say '10' - what if there was then a situation where the probability of the same event happening between 1000 and 2000 times was 1/2 - so 1-10 is P=1/2 1000-2000 is 1/2

The above could all make sense, but you can see that the average is never going to be 10 only.

+++++++++++++++++++++++++++++++++++++

After your first roll, you either get a 6 and finish in 1 (probability 1/6), or you get a non-six and are back in the same position you were in at the start, with an expectation of a further E rolls needed (plus the one you made) - probability (5/6)

E = 1/6 + 5/6(E + 1)

(1/6)E = 1

E = 6

Cato
  • 1,433
0

Let's have an experiment with n possibilities $P_1,\ldots,P_n$ with uniform distribution. Let $m$ be the expected number of tries an specific case occur, say $P_k$.

Since all cases occur with the same probability $1/n$, we must have $m\geq n$ otherwise $P_k$ occurs with higher probability than others, a contradiction.

On the other hand, if $m>n$ then pigeonhole principle guarantees the existence of some $P_i$, in any sequence of tries, that occurs twice before $P_k$, which is again impossible as the distribution is uniform.

Thus $m=n$.