I know this isn't a mathematical proof yet, but it can give an approximate answer to the probability by using a large random data set.
So first lets have a method of randomly generating a number in a circle as per this Disk Point Picking formula.
Defining $r \in [0,1]$ and $\theta \in [0,2\pi]$ we can use
$$x = \sqrt{r} \cos \theta$$
$$y = \sqrt{r} \sin \theta$$
Using that to generate 4 sets of random points we then have to calculate if one of them is in the triangle of the other three points. For this I used the answer to the question determine whether point lies inside triangle which advised using barycentric coordinates
Defining $p$ as the point to check and $p_1$, $p_2$, $p_3$ to points to check against it gave the following formula.
$$\alpha = \frac{(p_2.y - p_3.y)\cdot (p.x - p_3.x) + (p_3.x - p_2.x)\cdot (p.y - p_3.y)}{(p_2.y - p_3.y)\cdot (p_1.x - p_3.x) + (p_3.x - p_2.x)\cdot (p_1.y - p_3.y)}$$
$$\beta = \frac{((p_3.y - p_1.y)\cdot (p.x - p_3.x) + (p_1.x - p_3.x)\cdot (p.y - p_3.y))}{((p_2.y - p_3.y)\cdot (p_1.x - p_3.x) + (p_3.x - p_2.x)\cdot (p_1.y - p_3.y))}$$
$$\gamma = 1.0 - \alpha - \beta$$
If $\alpha$, $\beta$ and $\gamma$ are all greater than zero than the point is within the triangle.
You then have to do the same thing for the other 3 points.
I then ran it 200 times and recorded each time whether one of the points was within the triangle of the other three and got an overall average of 32% (Note: See Edit 2 where we run over more iteration using Google Go code and get around 29.5%, also the Go Code uses a rejection sampling method to generate x and y rather than Disk Point Picking)
EDIT:
As my result has been challenged I will add more details as to what I believe the original question is asking, and how I achieved my results.
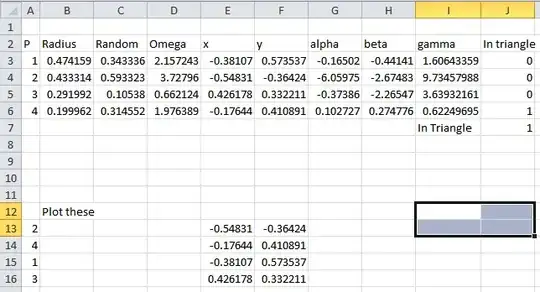
I actually set it up in an Excel spreadsheet so not only could I calculate things, I could graphically see if the results were correct at the same time.
Below is what the spreadsheet is looks like
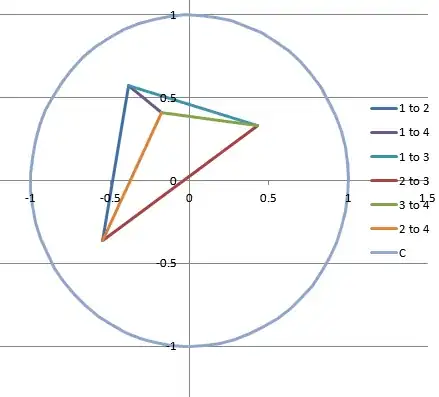
 And this the graph showing the same four points with 4 inside the triangle of points 1 through 3
Here is what the formulas in the spreadsheet are.
The Radius & Random column both just contain =RAND()
For the Omega Column the first cell contains =C3*2*PI() i.e. $Random*2*\pi$ and this copied down for the other three cells.
For the x column the first cell contains =SQRT(B3)*COS(D3) and again copied down
For the y column the first cell contains =SQRT(B3)*SIN(D3) and again copied down
I then defined the x and y columns with names of p1.x, p1.y, p2.x, p2.y etc. this is so I could easily use the barycentric coordinates formula and update them for each point.
For the alpha
(G3) =((p3.y - p4.y)*(p1.x - p4.x) + (p4.x - P3.x)*(p1.y - p4.y)) / ((p3.y - p4.y)*(P2.x - p4.x) + (p4.x - P3.x)*(p2.y - p4.y))
(G4) =((p3.y - p4.y)*(P2.x - p4.x) + (p4.x - P3.x)*(p2.y - p4.y)) / ((p3.y - p4.y)*(p1.x - p4.x) + (p4.x - P3.x)*(p1.y - p4.y))
(G5) =((p1.y - p4.y)*(P3.x - p4.x) + (p4.x - p1.x)*(p3.y - p4.y)) / ((p1.y - p4.y)*(P2.x - p4.x) + (p4.x - p1.x)*(p2.y - p4.y))
(G6) =((p3.y - p1.y)*(p4.x - p1.x) + (p1.x - P3.x)*(p4.y - p1.y)) / ((p3.y - p1.y)*(P2.x - p1.x) + (p1.x - P3.x)*(p2.y - p1.y))
For beta
(H3) =((p4.y - p2.y)*(p1.x - p4.x) + (P2.x - p4.x)*(p1.y - p4.y)) / ((p3.y - p4.y)*(P2.x - p4.x) + (p4.x - P3.x)*(p2.y - p4.y))
(H4) =((p4.y - p1.y)*(P2.x - p4.x) + (p1.x - p4.x)*(p2.y - p4.y)) / ((p3.y - p4.y)*(p1.x - p4.x) + (p4.x - P3.x)*(p1.y - p4.y))
(H5) =((p4.y - p2.y)*(P3.x - p4.x) + (P2.x - p4.x)*(p3.y - p4.y)) / ((p1.y - p4.y)*(P2.x - p4.x) + (p4.x - p1.x)*(p2.y - p4.y))
(H6) =((p1.y - p2.y)*(p4.x - p1.x) + (P2.x - p1.x)*(p4.y - p1.y)) / ((p3.y - p1.y)*(P2.x - p1.x) + (p1.x - P3.x)*(p2.y - p1.y))
For gamma the first cell contains =1-G3-H3 and copied down
For in triangle the first cell contains =IF(G3<=0,0,IF(H3<=0,0,IF(I3<=0,0,1))) and copied down
For (J7) =SUM(J3:J6)
And if you are wondering about the Plot section, that was just so I could get the graph to draw each line independently making it possible to work out which point is which visually. I also have another section of static data, which is not shown, to draw the circular line.
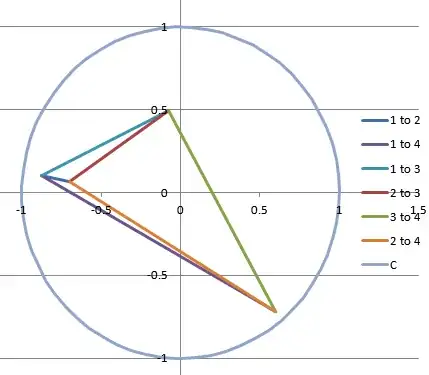
Here is another example of one of the points being within the other three, in this case point #2

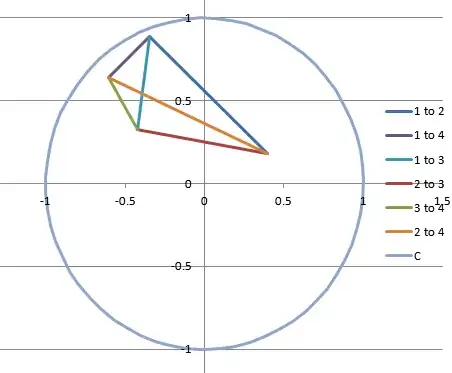
And here is an example of no points falling with the triangles.

Because the RAND() causes the values to change each time, I set up a table with rows 1-10 and columns 1-10 and record the result 0 or 1 in each cell. Then afterwards you can just get an average of them to determine the percentage of ones where one of the points is in the triangle of the other three points. Very manual I know but it allows you to visibly check the results each time.
Please feel free to reproduce this, or if you like I can publish the spreadsheet so you can download it.
EDIT2
And here is the Google GO code altered to actually generate 4 points and test all four points. Note; Running this over 1000 iterations gets closer to 29.5% which is probably more accurate.
EDIT3
Seeded the random number generation, without it you get exactly the same results each time.
Note: The Total probability of hitting a triangle is probably not accurate as it doesn't account for any overlap of any of the triangles (e.g. when one point is inside the triangle of the other three).
package main

import (
    "fmt"
    "math/rand"
    "math"
    "time"
)

var rejected int = 0
var calls int = 0

type point struct {
    x float64
    y float64
}

func rpoint() point {
    var p point
tryagain:
    calls++
    p.x = 2.0*rand.Float64()-1.0;
    p.y = 2.0*rand.Float64()-1.0;
    len := p.x*p.x + p.y*p.y
    if len > 1.0 {
        rejected++
        goto tryagain;
    }
    return p
}

func lensq(p1 point, p2 point) float64 {
    x := p1.x - p2.x
    y := p1.y - p2.y
    l := math.Sqrt(x*x + y*y)
    return l
}

func area(p1 point, p2 point, p3 point) float64 {
    a := lensq(p1, p2)
    b := lensq(p3, p2)
    c := lensq(p3, p1)
    s := (a + b + c)/2.0
    hero := math.Sqrt(s*(s-a)*(s-b)*(s-c))
    return hero
}

func intriangle(p point, p1 point, p2 point, p3 point) int {
 alpha := ((p2.y - p3.y)*(p.x - p3.x) + (p3.x - p2.x)*(p.y - p3.y)) / ((p2.y - p3.y)*(p1.x - p3.x) + (p3.x - p2.x)*(p1.y - p3.y))
 beta := ((p3.y - p1.y)*(p.x - p3.x) + (p1.x - p3.x)*(p.y - p3.y)) /  ((p2.y - p3.y)*(p1.x - p3.x) + (p3.x - p2.x)*(p1.y - p3.y))
 gamma := 1.0 - alpha - beta

 isin := 1

 if (alpha <= 0) {
    isin = 0
 }

 if (beta <= 0) {
    isin = 0
 }

 if (gamma <= 0) {
    isin = 0
 }

 return isin

}

func main() {
    max := 100000
    total := 0.0
    total2 := 0.0 // Needed for the other triangles with 4 points
    total3 := 0.0
    total4 := 0.0

    point1intotal := 0
    point2intotal := 0
    point3intotal := 0
    point4intotal := 0

    rand.Seed(time.Now().UTC().UnixNano())

    for test := 0; test < max; test++ {
        p1 := rpoint()
        p2 := rpoint()
        p3 := rpoint()
        p4 := rpoint()
        a := area(p1, p2, p3)
        total += a
        a2 := area(p2, p3, p4)
        total2 += a2
        a3 := area(p2, p4, p1)
        total3 += a3
        a4 := area(p4, p1, p3)
        total4 += a4

        point1intotal += intriangle(p1, p2, p3, p4)
        point2intotal += intriangle(p2, p1, p3, p4)
        point3intotal += intriangle(p3, p1, p2, p4)
        point4intotal += intriangle(p4, p1, p2, p3)
    }
    fmt.Println("average area triangle 1 = ",total/(float64(max)))
    fmt.Println("average area triangle 2 = ",total2/(float64(max)))
    fmt.Println("average area triangle 3 = ",total3/(float64(max)))
    fmt.Println("average area triangle 4 = ",total4/(float64(max)))

    // Lets calcuate the probabilities outside of the Print so we can add them
    probability1 := total/(float64(max)*math.Pi)
    probability2 := total2/(float64(max)*math.Pi)
    probability3 := total3/(float64(max)*math.Pi)
    probability4 := total4/(float64(max)*math.Pi)

    // Add the probabilities & points in triangle
    totalprobability := probability1 + probability2 + probability3 + probability4
    totalintriangle := point1intotal + point2intotal + point3intotal + point4intotal

    fmt.Println("probability of hitting triangle 1= ",probability1)
    fmt.Println("probability of hitting triangle 2 = ",probability2)
    fmt.Println("probability of hitting triangle 3 = ",probability3)
    fmt.Println("probability of hitting triangle 4 = ",probability4)
    fmt.Println("Total probability of hitting a triangle = ",totalprobability)

    // As a check, see if we get a value close to PI here.
    fmt.Println("rejected = ", rejected, 4.0*float64(calls-rejected)/float64(calls))

    fmt.Println("Point 1 in triangle= ",point1intotal)
    fmt.Println("Point 2 in triangle= ",point2intotal)
    fmt.Println("Point 3 in triangle= ",point3intotal)
    fmt.Println("Point 4 in triangle= ",point4intotal)
    fmt.Println("Total Points in triangle= ",totalintriangle)
    fmt.Println("Total percentage in triangle= ",float64(totalintriangle)/(float64(max)))

}
Results
average area triangle 1 =  0.23174344583609957
average area triangle 2 =  0.23199478541566787
average area triangle 3 =  0.2325415159584758
average area triangle 4 =  0.23231070178729094
probability of hitting triangle 1=  0.07376622986792832
probability of hitting triangle 2 =  0.07384623374089419
probability of hitting triangle 3 =  0.07402026347774858
probability of hitting triangle 4 =  0.07394679304518911
Total probability of hitting a triangle =  0.29557952013176025
rejected =  108797 3.144672629752141
Point 1 in triangle=  7505
Point 2 in triangle=  7361
Point 3 in triangle=  7300
Point 4 in triangle=  7299
Total Points in triangle=  29465
Total percentage in triangle=  0.29465
EDIT 4
Given a triangle in a circle, the chance of a random point landing in the triangle is the area of a triangle divided by the area of a circle.
Area of triangle = $\lvert P1.x*(p2.y-p3.y)+P2.x*(p3.y-P1.y)+P3.x*(P1.y-p2.y) \rvert \over 2$
Area of a circle = $\pi r^2$
So probability = $\lvert P1.x*(p2.y-p3.y)+P2.x*(p3.y-P1.y)+P3.x*(P1.y-p2.y) \rvert \over 2 \pi r^2$
Lets say we have a triangle with
$P_1(x,y)=(-0.5,0)$
$P_2(x,y)=(0.5,0)$
$P_3(x,y)=(0,0.1)$
Then there are four areas the fourth points can land it so that one of the points is in a triangle. The additional areas are those where if you extend the lines of the original triangle so that they intersect the circle. The areas that lie between the point and the circle will also cause a triangle to form with one of the points in it.
The blue area for point 1, the yellow for point 2 and the pink for points 3.
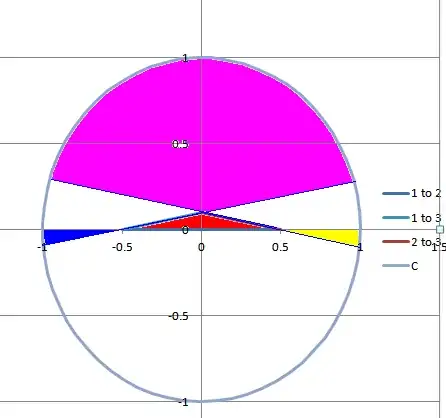
This is most clearly shown with point 3 in triangle formed by points 1,2 & 4

So we have to add those three areas to the triangular area to work out the probability.
However that is rather complicated as you would have to work out the intersections to the circle and work out the average size of pie shaped areas. There is an easier approach for, see my other answer which gives the mathematics.
 And this the graph showing the same four points with 4 inside the triangle of points 1 through 3


