Let me ask about spline functions. I tried spline() function of Octave then I found it was almost I wanted , to draw a smooth curve through given 2D points. But for some points data , it plots unexpected lines. I think it does because each my data is allowed to have multiple values for an x-value.For example (x=1,y=1) , (x=1,y=10). To solve this problem , I plan to use the concept of parametric forms of functions. Namely I plan to apply the spline() function on respectively (t,x) values data and (t,y) values data. I expect it will work well for almost all cases. Question 1 , possibly will it? If yes,I have the 2nd question. I want any resultant curve has the minimum number of inevitable changes of the direction of curve.For example , the number for a circle is zero. Because if you travel along the line in one direction, you always turns right or always turns left. Question 2 , will my plan possibly satisfy the condition. If no , I have the 3rd question , is there any algorithm to satisfy the condition?
2 Answers
Please check out this article below.
http://www.codeproject.com/Articles/31859/Draw-a-Smooth-Curve-through-a-Set-of-2D-Points-wit
- 156
I've never learnt about splines and Bezier curves, but I figured out a way to do this using high school maths in a way which suits my particular embedded programming application. There might be a name for this, but I imagine it's a bit rudimentary for most people.
Approach
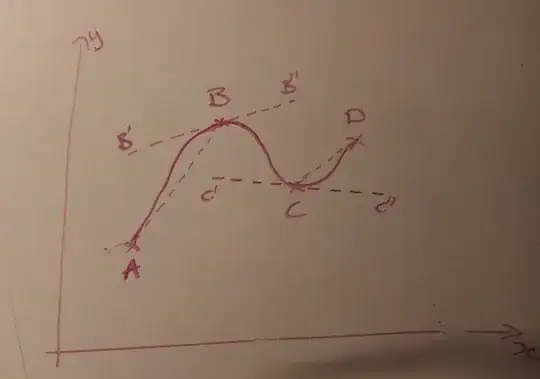
Let's image a series of four given points, A, B, C and D with increasing X-coordinates.
Now let's define some lines we'll call tangents. They'll be tangential to our final curve, and they're shown as dashed lines in the picture below.
- The tangents at the first and last points will be the line straight from that point to the adjacent one (i.e. AB and CD). (I'm planning to refine this because it results in unnecessary inflections at the start and end of the curve).
- The tangent through an intervening point will be at the same gradient as a line through the previous and next points.
- Between the given points, the curve is influenced by the preceding and following tangents. The degree of influence depends on the proximity.
We now just need to find a nice gradual way for one tangent to hand over control to the next so that there are no kinks in our curve. We need a curve for that - one that starts horizontal with a value of 1 (complete control) and ends horizontal at 0 (no influence). A cosine wave (with some help) does this nicely, but I imagine a cubic polynomial would also work.
The formula
Let's say we're looking to plot point $J$ whose coordinates will be $(x_j, y_j)$ between two adjacent given points - $I$ with coordinates $(x_i, y_i)$ and $K$ with coordinates $(x_k, y_k)$, and that the formulae describing the tangents through $I$ and $K$ are:
$y = a_i x + b_i $
$y = a_k x + b_k $
The "degree of influence" $F_i$ of the $I$ tangent will be a number between 0 and 1 inclusive, given by
$$ F_i = 1+\frac{cos\left( \frac{\pi(x_j - x_i)}{2(x_k - x_i))} \right)}{2} $$
The degree of influence $F_k$ of the $K$ tangent is $1 - F_i$
Using all that, we can now plot $(x_j, y_j)$ as follow:
$$ y_j = F_i(a_ix_j + b_i) + F_k(a_kx_j + b_k) $$
- 123
