In the book "An Introduction to Statistical Learning with Applications in Python, Trevor Hastie et al., Springer", there's the following paragraph:
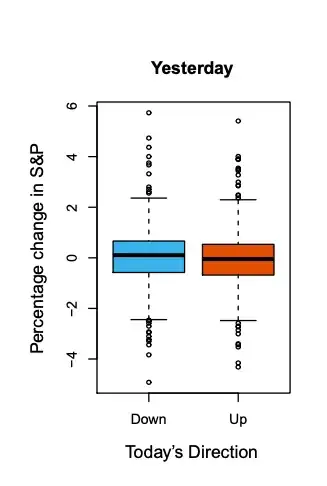
The left-hand panel of Figure 1.2 displays two boxplots of the previous day’s percentage changes in the stock index: one for the 648 days for which the market increased on the subsequent day, and one for the 602 days for which the market decreased.
Figure 1.2 (the left-hand panel)
It's not obvious to me why then the authors concluded:
The two plots look almost identical, suggesting that there is no simple strategy for using yesterday’s movement in the S&P to predict today’s returns.
Suppose in the boxplot for the "Up" bucket on the right, the median drops to $-4$ for example, then my understand is that in this case there's some strategy to predict today's return based on yesterday's movement. If so then what is that and why it's not applicable for the case in the image?
