To put some math to it, as other answers note, the cycle is nearly sinusoidal (I guess factors like eccentricity of orbit and the oblate shape adjust it just a bit)
So we can use cosine or sine as the basic shape. So base it on $$f = \sin t$$ (with basically t being how far into the lunar month we are, and f being the result of how full the moon is)...
(More precisely, it'd be $f = \frac{\sin {\frac{2\pi}{S}t}+ 1}{2}$ to normalize the results to be between 0 and 1, and to convert from days to radians, but those factors don't alter the basic math ideas ahead, so will just stick with the basic trig function)
But instead of knowing the date and wanting to know how full the moon is, we are working from how full the moon is, and asking how many days it is there... so it's the inverse function we'd use:
$$t = \arcsin f$$
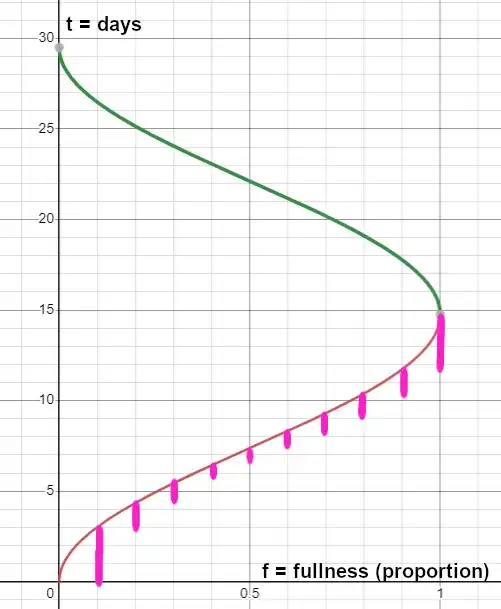
The pink is the amount of time in each bin. Note that the top half of the graph (itself needed added construction to arcsin, since otherwise it's not technically a function) isn't needed, as it has the same amounts as the bottom half.
The idea in the question that it spends more time in "green" zone than the "red" because it duplicates doesn't work... every spot on the graph is found 2 times in a cycle, except the singular points of absolute fullness and newness... and these are bins, not instantaneous points, so those two points mean infinitesimally nothing -- in other words if you extend your cycle worms a bunch more times, you'd see there's basically the same number of crossing through each green circle as the red, not double\more.
How do we calculate how much time it spends in bins? We want $\Delta t $ $(\equiv t_{f2} - t_{f1})$.
But what's nice is that $\Delta t$ is related to the chosen $\Delta f$ in slope... which calculus shows at any point is the derivative. So $\Delta t ≈ \Delta f \cdot dt/df$
What's the derivative of arcsin? $$\frac{dt}{df} = \frac{1}{\sqrt{1-f^2}}$$
And that has a graph shape of:
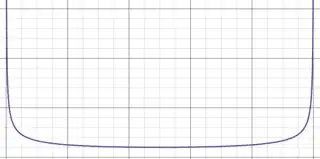
And viola, that's your shape.
Note that the derivative actually goes to infinity at the edges, the full and new moon... indicating that as you choose smaller and smaller bin sizes... the frequency graph would likewise be proportionally more and more dominated by those edges (infinitely so, if you chose infinitely small bins). For reasonable sized bins you just see a graph like yours!
So long story short, as others noted, sinusoidal functions change faster through the middle of the graph than the edges. That's why, for example, in midlatitude sites you'll actually see more days with extreme sunrise/sunsets than the middle ground 6 AM - 6 PM (solar noon) 12-hour period. Because again, the sunrise/sunset are changing much more quickly during the spring/autumn, meaning much fewer days in those middle values, than at the edges.


